视觉中的热舒适
Thermal Comfort in Sight
Thermal affordance and its visual assessment
热可供性及其视觉评估

Core idea: research gaps → Thermal Affordance → VATA → validated city-scale assessment.
相关链接
引言:城市热环境的挑战
日益加剧的城市热岛(UHI)效应对全球城市构成重大挑战。它驱动极端气候变化、增加制冷能耗,并通过恶化空气质量与降低室外热舒适(OTC)而损害公众健康。OTC 指个体对城市热环境的主观满意度,对城市宜居性至关重要。较差的 OTC 可能导致热相关疾病,甚至影响心理健康。
传统 OTC 评估方法依赖现场调查与环境测量,往往成本高昂、资源密集,且在空间尺度与精度上受限。尽管 PET、PMV、UTCI 等指标已存在,在复杂城市环境中有效应用仍具挑战。
近年来,街景影像(SVI)与计算机视觉的结合为大规模街景分析提供了有前景的路径。SVI 既能捕捉客观的图像特征(IF)(如几何与绿化),也能通过调查获取主观的视觉感知指标(VPI)(如舒适度与围合感)。已有研究将 SVI 特征与热环境相联系,但显著的研究空白仍然存在。
研究空白与我们的回应
- 缺乏统一概念: 尚无清晰理论框架,将建成环境的客观属性与街景设计中的热舒适潜力相联系。
- 我们的回应: 引入 Thermal Affordance(热承载力/热可供性) 概念,受 Gibson 理论启发,用以描述街景构型影响热舒适的内在能力。
- 视觉评估在热舒适中的应用有限: 利用 SVI 对人类街景热属性进行视觉评估的研究不足,且方法常缺乏与真实 OTC 数据的验证。
- 我们的回应: 提出 Visual Assessment of Thermal Affordance(VATA,热承载力视觉评估) 框架,整合 SVI 衍生的 IF 与基于调查的 VPI,以量化热承载力。
- 需要系统化工作流: 缺乏整合多源数据(SVI、调查、现场测量)用于城市尺度 OTC 评估的稳健、可复现工作流。
- 我们的回应: VATA 框架提供数据驱动工作流,整合上述数据源,支持经校验的热承载力预测与推断模型。
Thermal Affordance 的理念
Thermal Affordance 指环境(如街景)影响热舒适的内在能力,整合多种环境因素。其目标是:
- 统一性: 涵盖所有相关的固定环境变量。
- 客观性: 聚焦环境属性,而非仅主观感受。
- 启发性: 激发对热舒适的理解与分析。
- 空间依赖性: 强调环境之间的差异。
- 可解释性: 将环境属性与热舒适潜力相联系。
- 可扩展性: 允许随时间纳入额外变量。
VATA 框架
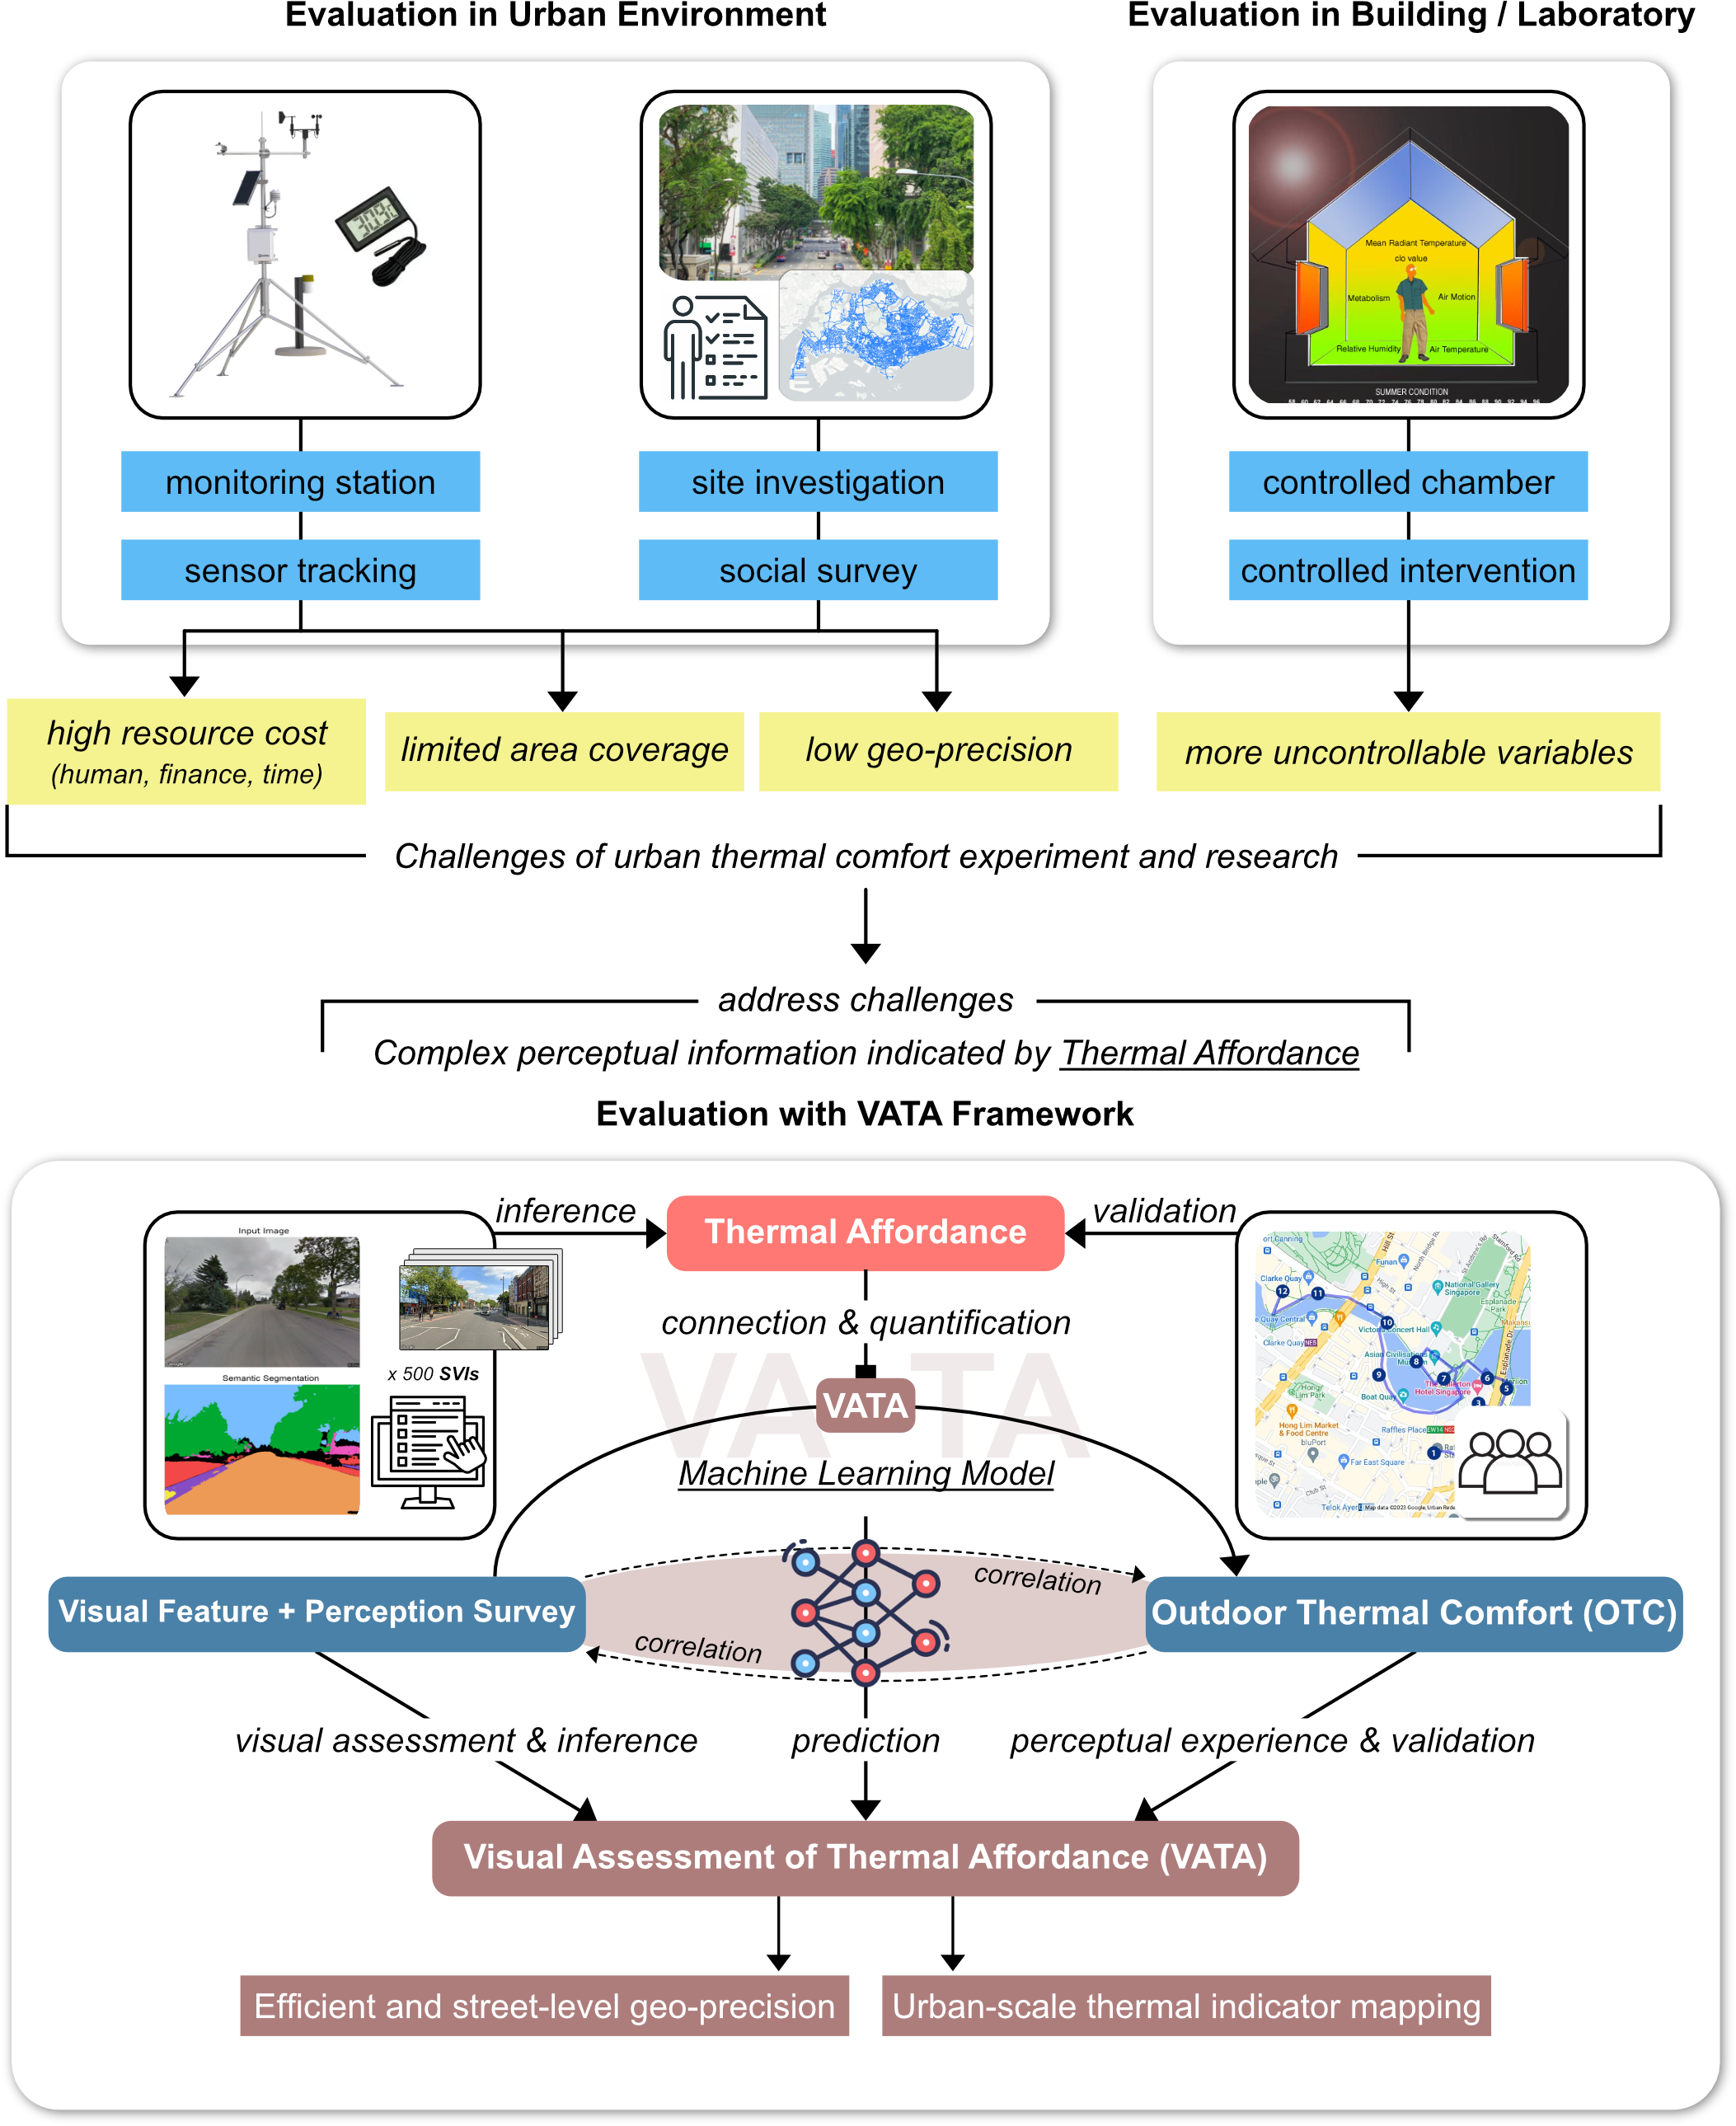
VATA 框架概览
VATA 框架应对传统 OTC 评估的挑战,利用视觉数据(SVI)、人类感知与热舒适之间的联系。
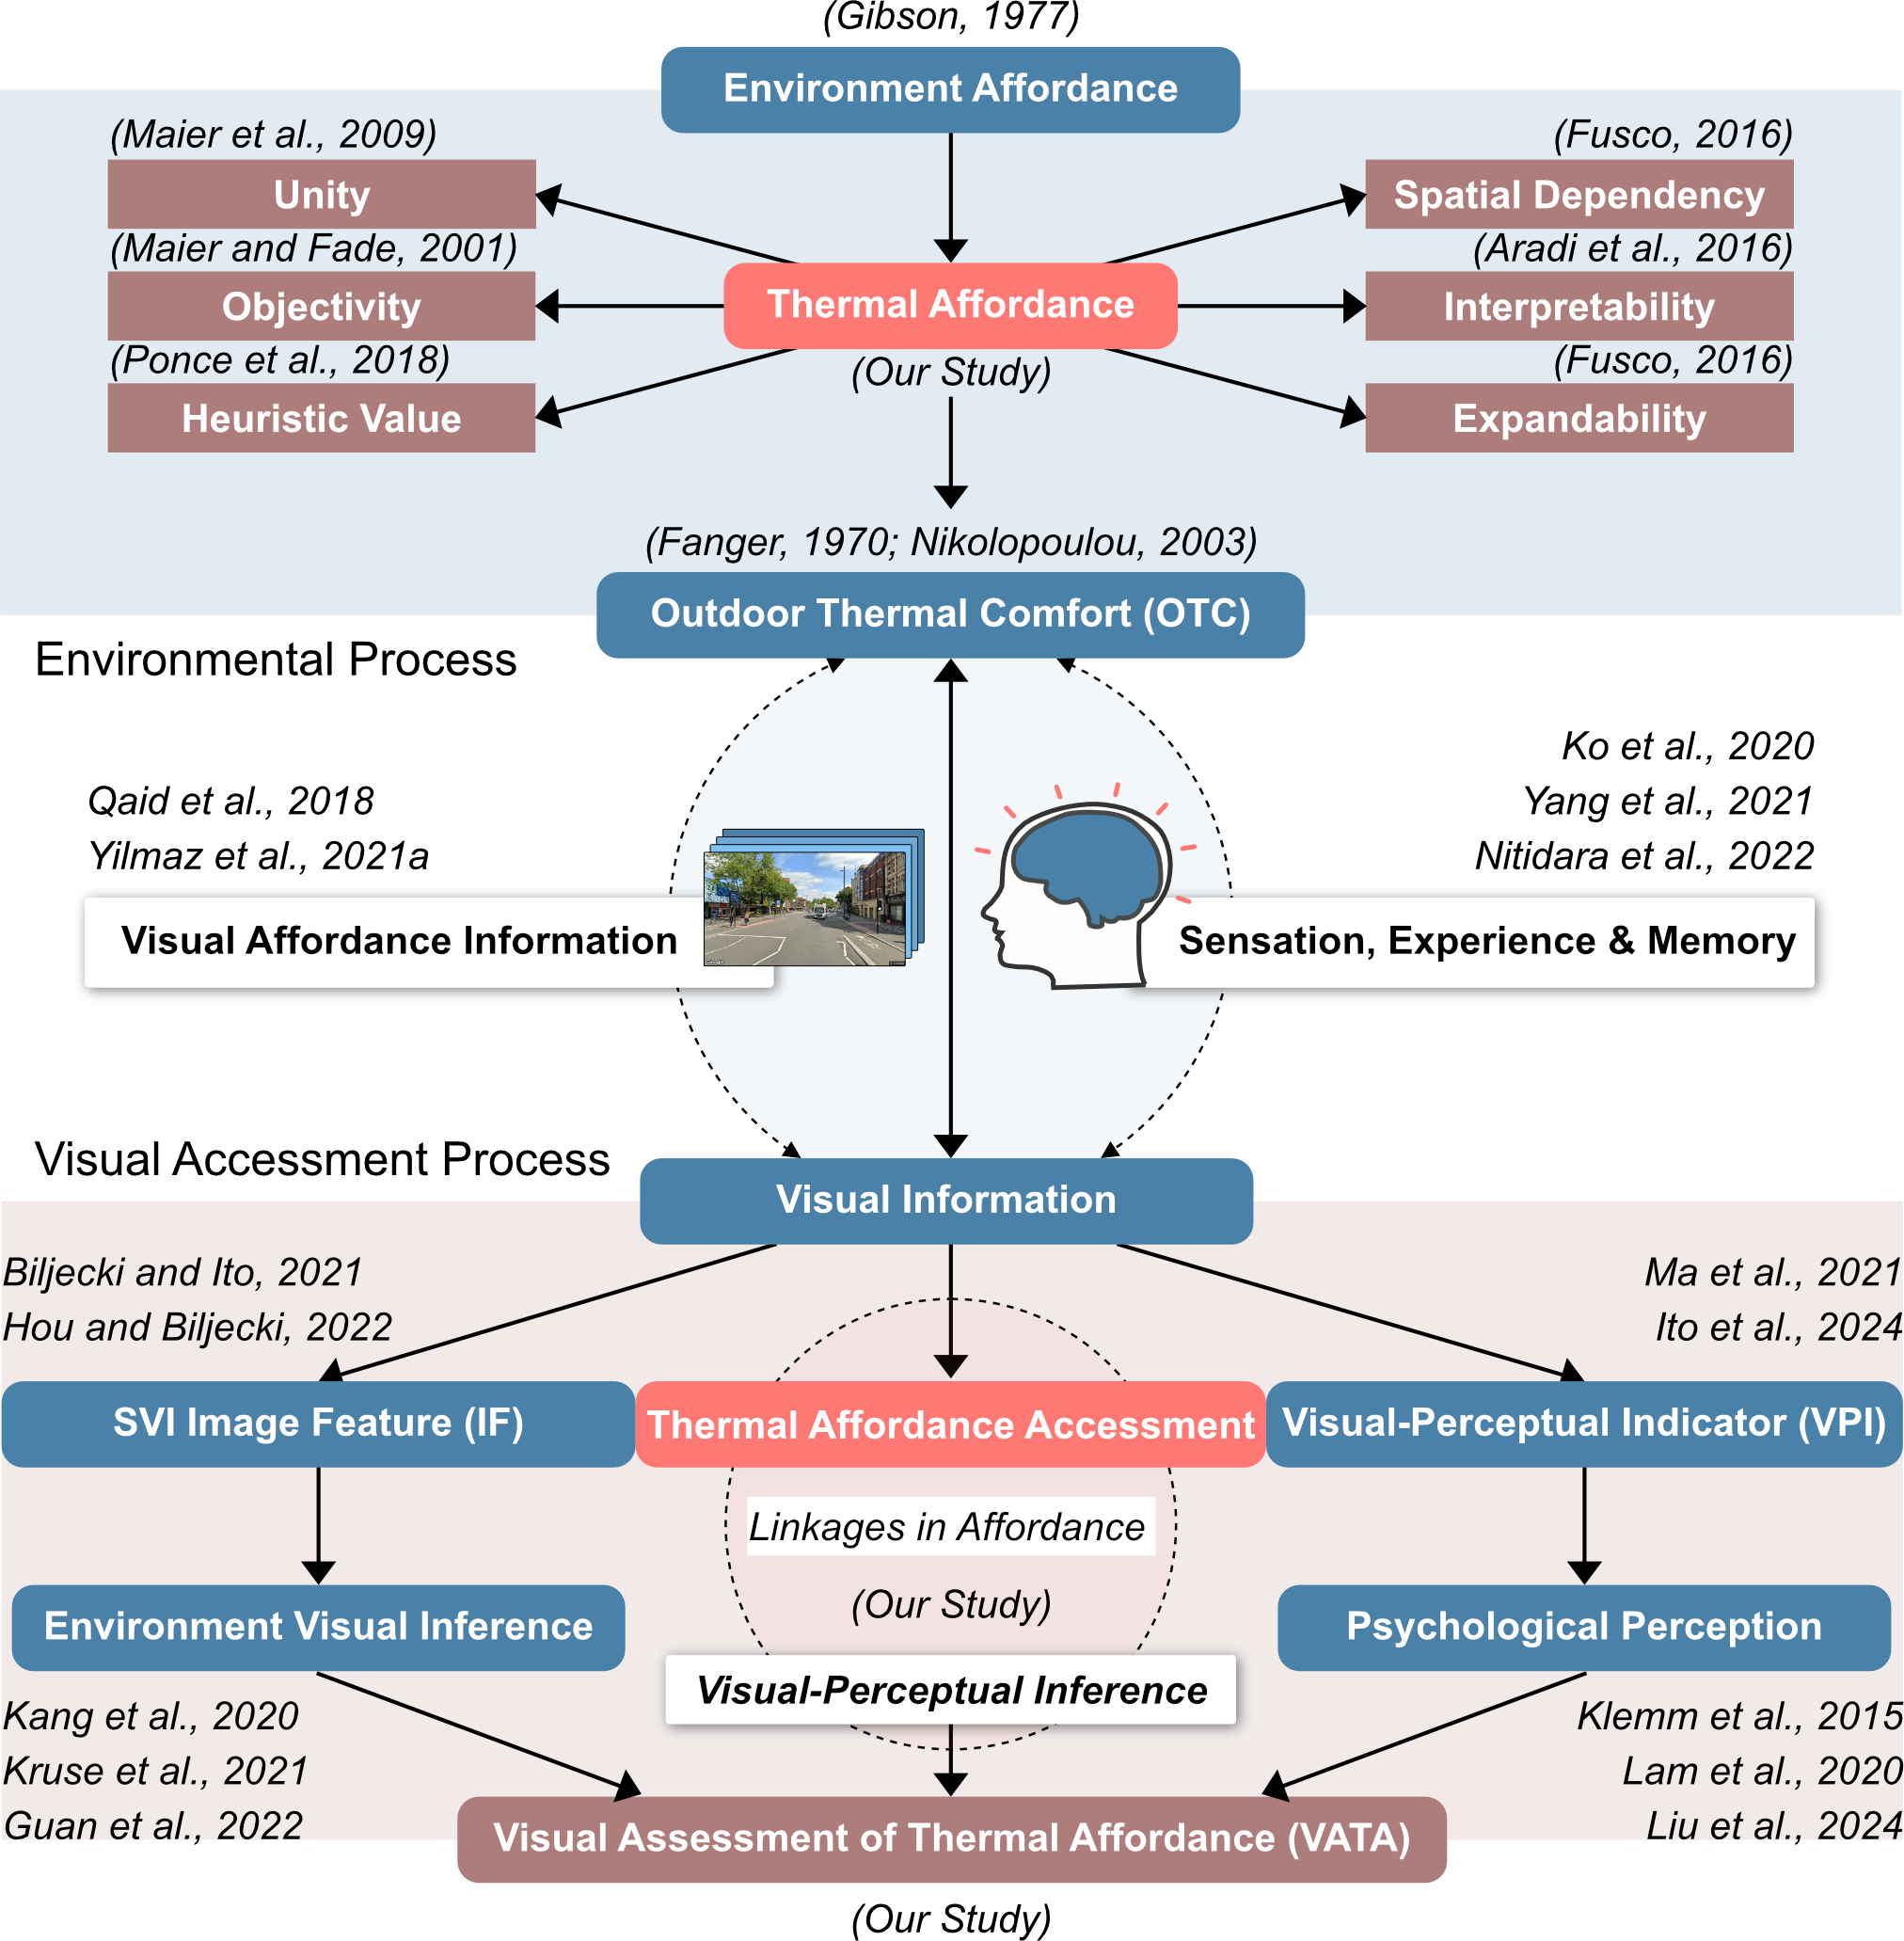
阐释 VATA 概念的概念框架
- 输入数据:
- 图像特征(IF): 通过计算机视觉从 SVI 提取(如语义分割获取绿化/建筑、目标检测获取车辆/行人、像素特征获取色彩/纹理、场景识别)。
- 视觉感知指标(VPI): 通过在线调查收集,参与者基于 19 项指标(如感知温度、绿化率、围合感、安全感、美观度)及 VATA 本身,对 SVI 配对进行比较。
- 建模:
- 多任务神经网络学习(MTNNL) 模型预测 VATA 分数,采用两阶段方法:IF 预测 VPI,再由 IF + VPI 预测 VATA。
- 弹性网络回归模型(ENRM) 用于推断,揭示特定 IF、VPI 与最终 VATA 分数之间可解释的关系。
- 验证: 将 VATA 预测与通过现场调查(热行走)收集的真实 OTC 数据对照验证,指标包括主观舒适评分与生理数据(如心率)。
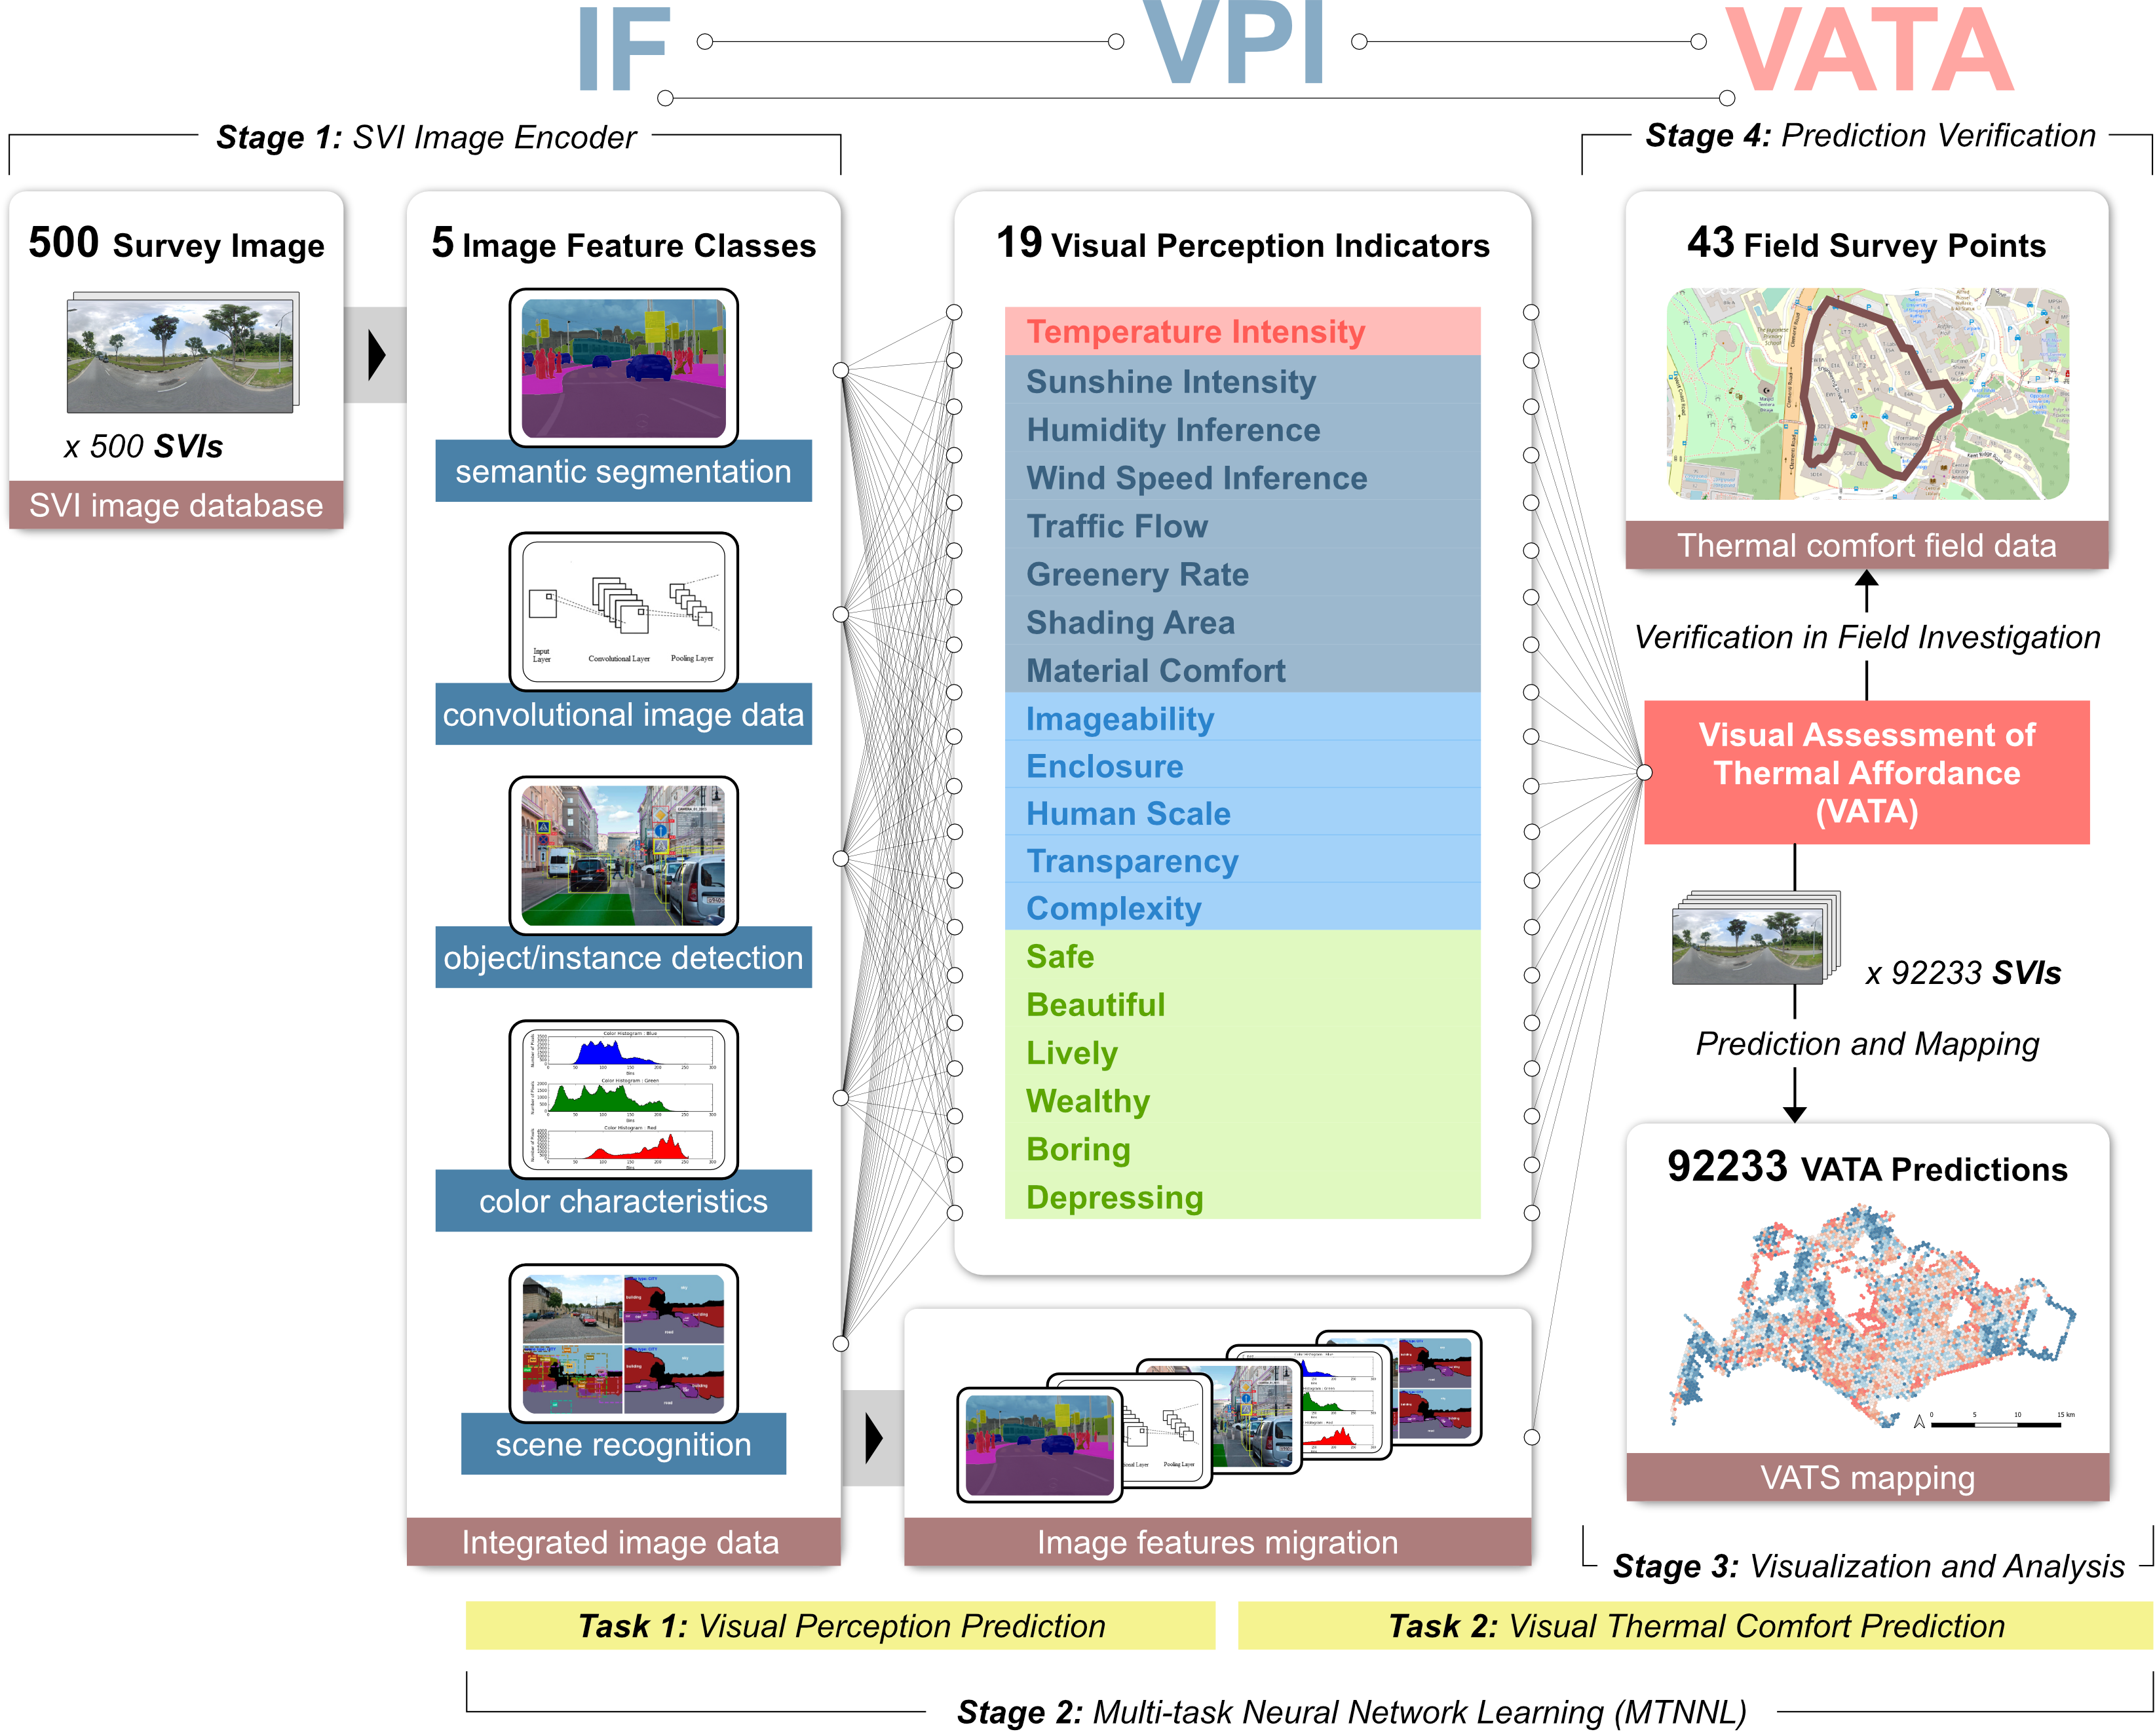
详细研究框架图
方法概要
- 研究区域: 新加坡(因其多样城市形态与一致热带气候而选定)。
- SVI 调查: 500 张代表性 SVI(从 92,233 张图像经 k-means 聚类选取)由 176 名参与者在线评估,对 VATA 与 19 项 VPI 进行配对比较。TrueSkill 算法将比较转换为 0–5 分制分数。
- IF 提取: 5 类 IF(共 52 个子特征)使用 DeepLabV3+、ResNet-50、Faster R-CNN 等模型从 SVI 提取。
- 模型训练: MTNNL 基于 IF 与 VPI 分数训练(60% 训练、20% 验证、20% 测试)。
- 推断建模: 训练 ENRM 以理解特征权重与关系。
- 验证: 将 43 个地点的预测 VATA 分数与 NUS 热行走期间收集的 OTC 数据(舒适评分、心率、太阳强度、噪声、海拔)比较。
主要结果
- 预测模型性能: MTNNL 模型表现优于其他机器学习模型(调整 R² = 0.7316),证明两阶段(IF → VPI → VATA)方法的有效性。
- 与 OTC 数据验证:
- 平滑后的 VATA 分数与热行走路径上的调查舒适评分呈强相关(使用适度平滑因子时调整 R² 最高达 0.75)。
- 结合 VATA 与生理/环境数据(心率、太阳强度、噪声、海拔——HSNA)的多元模型对舒适的解释方差显著高于 IF + HSNA(调整 R² = 0.778)或仅 HSNA(调整 R² = 0.596),调整 R² = 0.889。
- VATA 制图: 我们生成新加坡高分辨率 VATA 地图,聚合为六边形单元。该地图直观识别高(如 Windsor Nature Park、East Coast Park 等公园)与低(如 Choa Chu Kang 部分区域)热承载力区域,指导潜在干预。
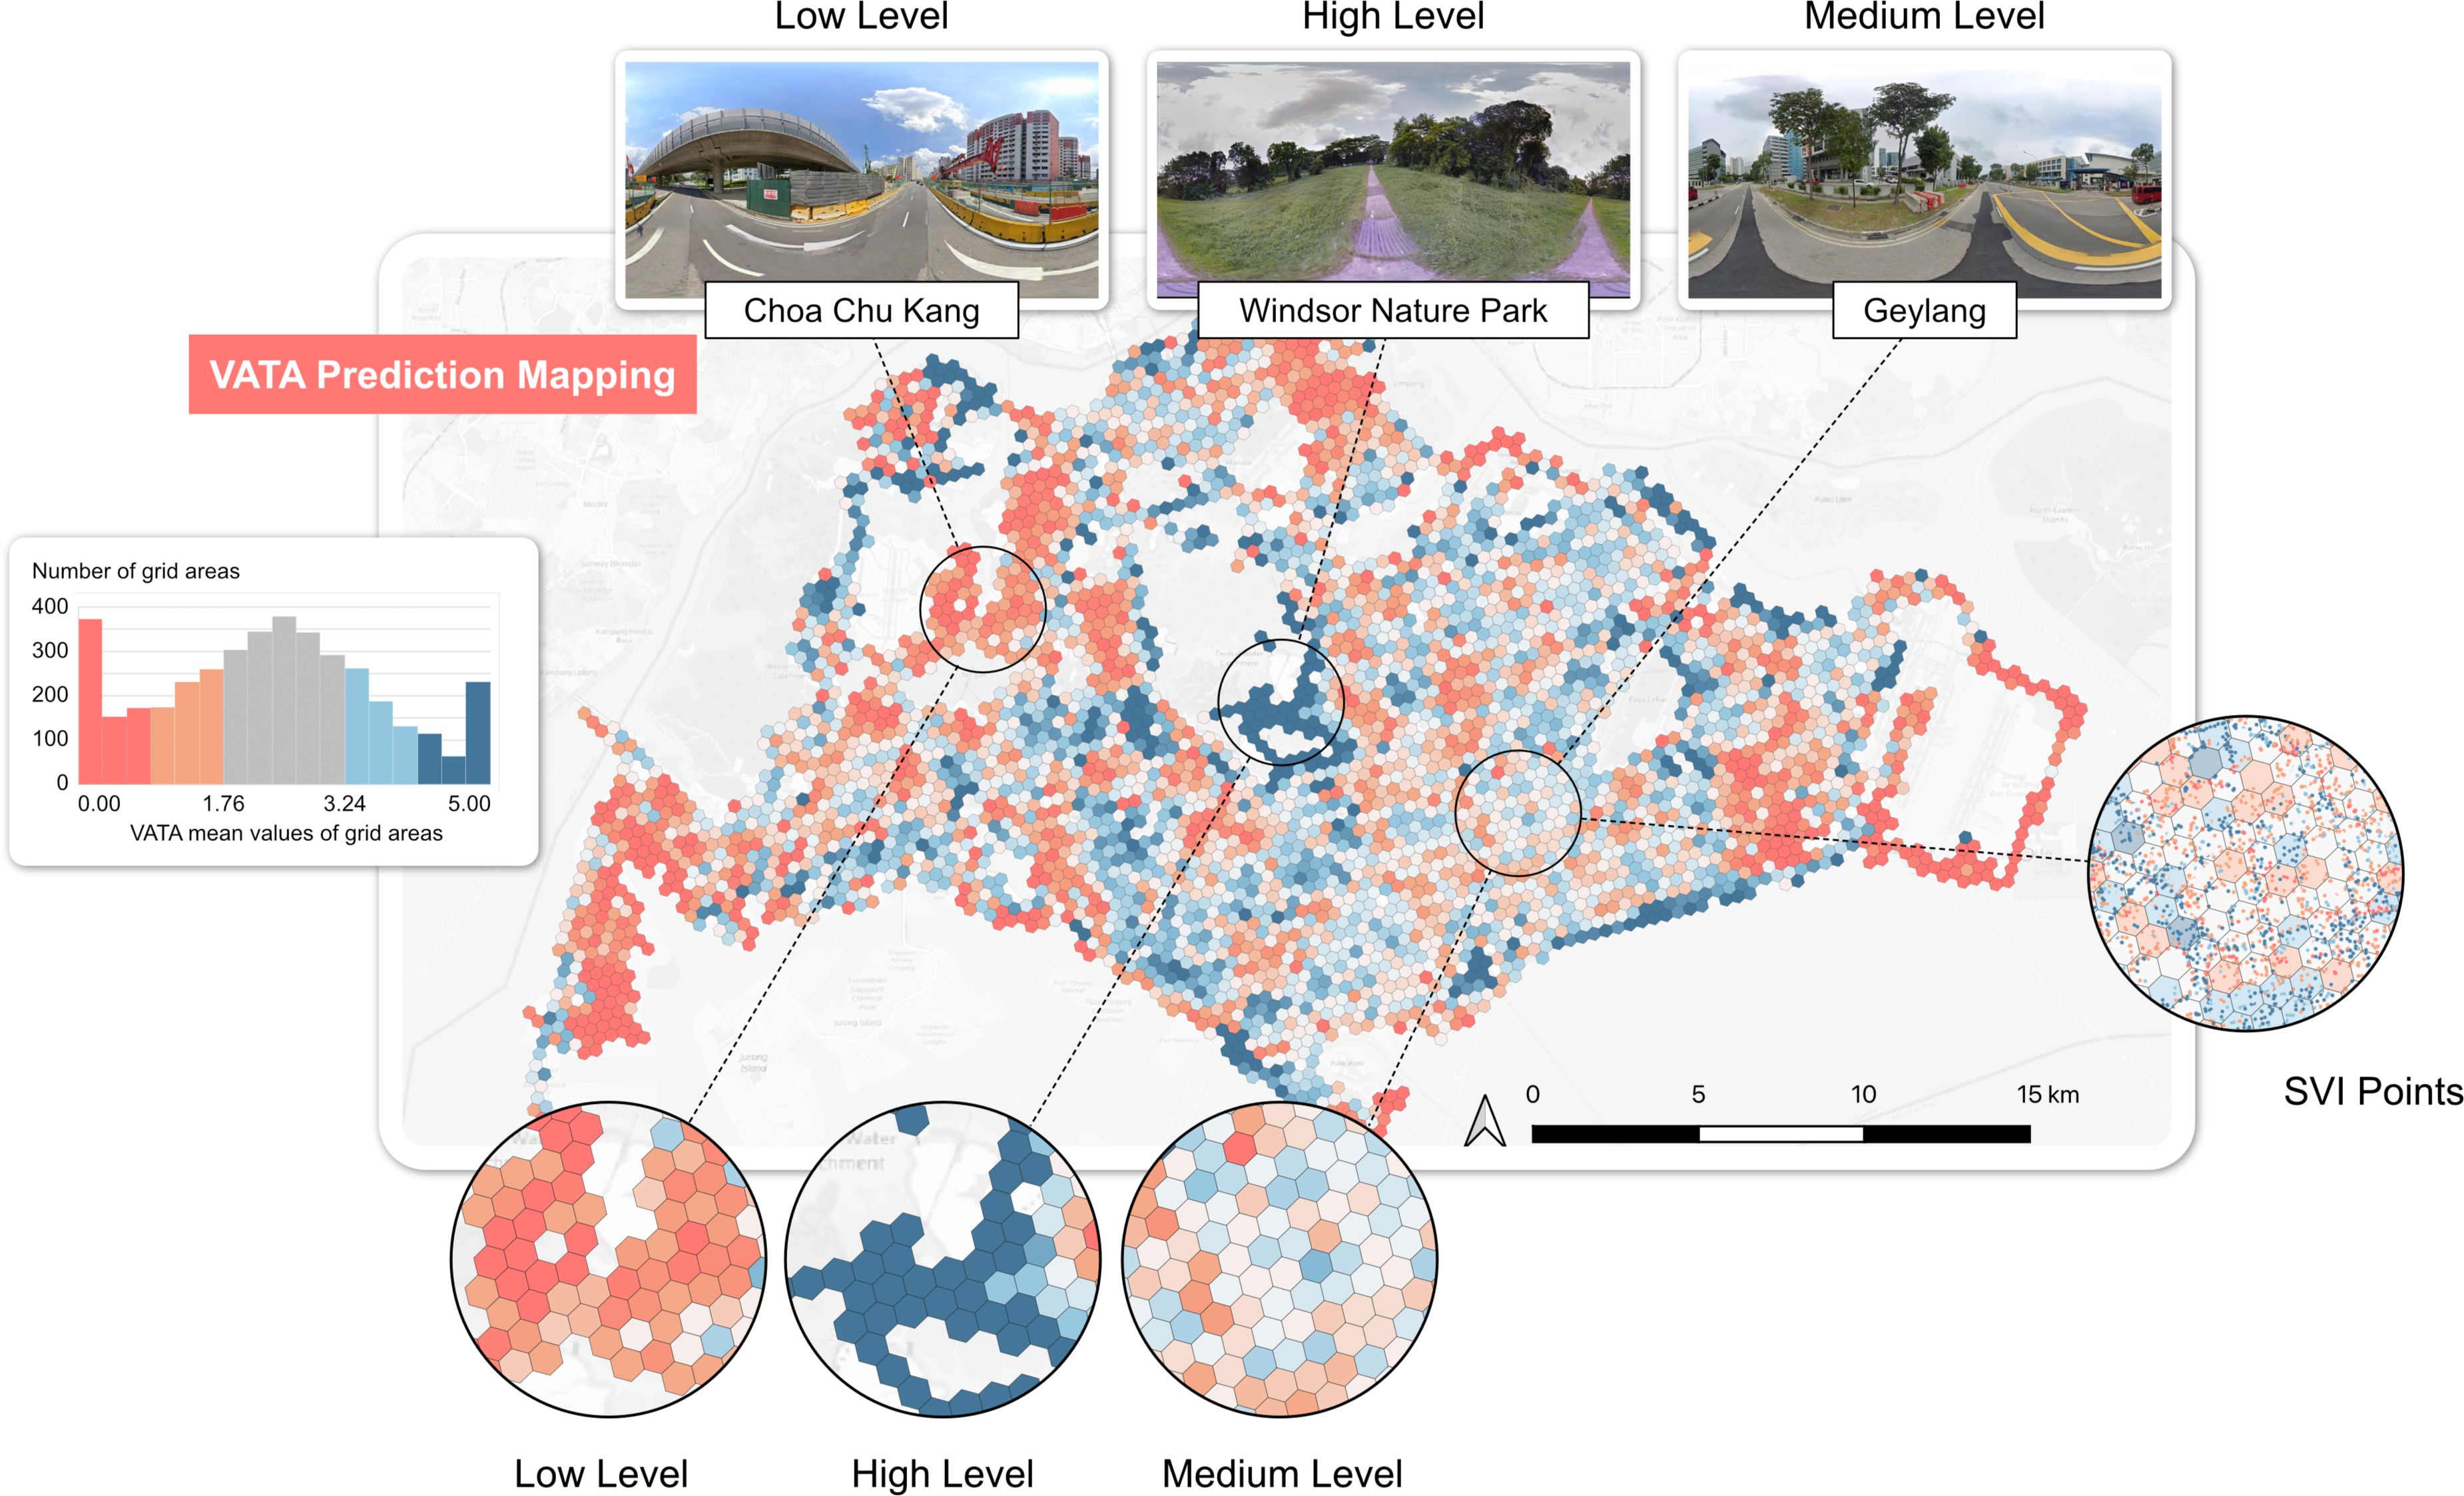
新加坡 VATA 预测结果制图
- 推断模型洞见: ENRM 模型(调整 R² = 0.744)揭示关键因素:
- 对 VATA 的正向贡献: 植被、地形、天空比例、阴影面积、人本尺度设计要素、感知湿度/风、感知美观/安全。
- 对 VATA 的负向贡献: 交通要素、复杂/施工场景、高像素细节/对比度、感知温度/阳光强度、感知交通流量/复杂度/单调感。
讨论与意义
VATA 框架为评估城市热承载力提供了可扩展、成本效益高且经校验的方法。
- 城市规划工具: 高分辨率 VATA 地图帮助规划者识别需改善区域,并优先安排增绿、遮阳等干预。
- 设计指导: 推断模型揭示哪些具体街景特征(IF)与感知品质(VPI)最影响热承载力,为循证设计决策提供依据。
- 持续监测: 框架支持持续监测循环,利用更新的 SVI 数据完善模型并追踪干预随时间的影响。
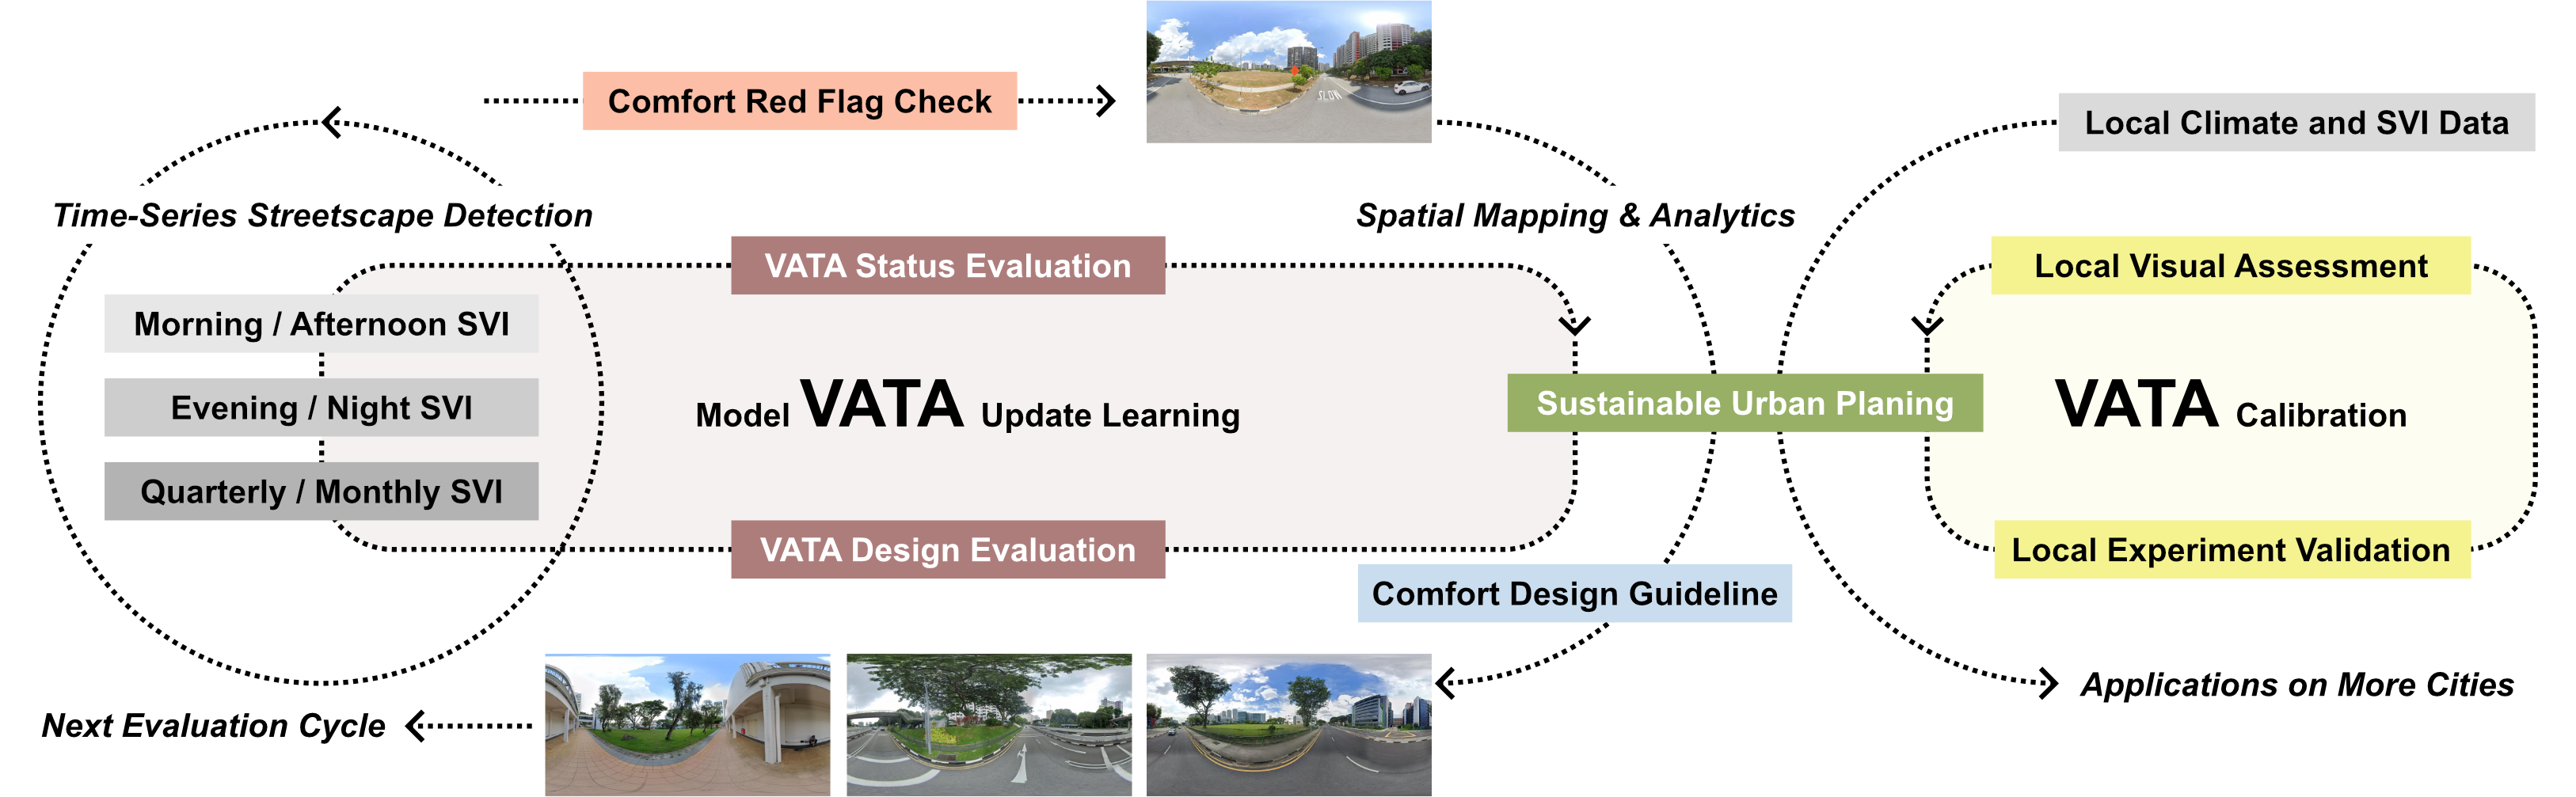
持续监测与设计循环示意图
- 可迁移性: 虽在新加坡开发,该方法可通过本地调查与验证适配其他城市。
局限与未来方向
- 时间变异: 未考虑 SVI 的时段、天气或季节变化。
- 验证范围: 验证限于一条路径;需在更多样地点与微气候下进行更广泛验证。
- 数据来源: 可整合卫星影像、LST 数据或详细微气候模拟以增强。
- 调查局限: 在线调查存在固有局限;纳入专家评估或有裨益。
- 跨城市验证: 在不同气候与城市语境中测试框架至关重要。
结论
本研究引入热承载力这一新颖概念及 VATA 评估框架。通过整合 SVI、人类感知调查、机器学习与现场验证,VATA 为评估与改善城市街景热舒适提供了有力工具,为可持续城市规划与设计提供可行动洞见,助力建设更宜居、更具韧性的城市。
Core idea: research gaps → Thermal Affordance → VATA → validated city-scale assessment.
Related Links
Introduction: The Challenge of Urban Heat
The intensifying Urban Heat Island (UHI) effect poses significant challenges to cities worldwide. It drives extreme climate changes, increases energy consumption for cooling, and degrades public health by worsening air quality and reducing outdoor thermal comfort (OTC) . OTC, defined as one’s subjective satisfaction with urban thermal conditions, is critical for urban livability . Poor OTC can lead to heat-related illnesses and even affect mental health .
Traditional methods for evaluating OTC rely on field surveys and environmental measurements, which are often costly, resource-intensive, and limited in spatial scale and precision . While indices like PET, PMV, and UTCI exist, applying them effectively in complex urban environments remains challenging .
Recent advances in using Street View Imagery (SVI) combined with computer vision offer promising avenues for large-scale streetscape analysis . SVI can capture both objective image features (IF) like geometry and greenery, and subjective visual-perceptual indicators (VPI) like comfort and enclosure through surveys . Studies have linked SVI features to thermal environments , but significant research gaps remain.
Research Gaps and Our Response
- Lack of a unifying concept: There’s no clear theoretical framework linking the objective properties of the built environment to thermal comfort potential in streetscape design.
- Our Response: We introduce the concept of Thermal Affordance, inspired by Gibson’s theory , to describe the inherent capability of a streetscape’s configuration to influence thermal comfort.
- Limited use of visual assessment for thermal comfort: Human visual assessment of streetscapes’ thermal properties using SVI is understudied, and methods often lack validation with real-world OTC data.
- Our Response: We propose the Visual Assessment of Thermal Affordance (VATA) framework, integrating SVI-derived IFs and survey-based VPIs to quantify thermal affordance.
- Need for a systematic workflow: There’s a lack of a robust, replicable workflow integrating multi-source data (SVI, surveys, in-field measurements) for urban-scale OTC evaluation.
- Our Response: The VATA framework provides a data-driven workflow that integrates these sources, enabling validated prediction and inference models for thermal affordance.
The Idea of Thermal Affordance
Thermal Affordance refers to the inherent capability of an environment (like a streetscape) to impact thermal comfort, integrating various environmental factors. It aims to be:
- Unified: Encompassing all relevant fixed environmental variables.
- Objective: Focused on environmental properties, not just subjective feelings.
- Heuristic: Inspiring understanding and analysis of thermal comfort.
- Spatially Dependent: Emphasising differences between environments.
- Interpretable: Linking environmental attributes to thermal comfort potential.
- Expandable: Allowing incorporation of additional variables over time.
The VATA Framework
VATA Framework Overview
The VATA framework addresses the challenges of traditional OTC evaluation. It leverages the connection between visual data (SVI), human perception, and thermal comfort.
Conceptual framework illustrating the VATA concept
- Input Data:
- Image Features (IF): Extracted from SVI using computer vision (e.g., semantic segmentation for greenery/buildings, object detection for cars/people, pixel features for colour/texture, scene recognition).
- Visual-Perceptual Indicators (VPI): Gathered through online surveys where participants compare pairs of SVIs based on 19 indicators (e.g., perceived temperature, greenery rate, enclosure, safety, beauty) plus VATA itself.
- Modelling:
- A Multi-Task Neural Network Learning (MTNNL) model predicts VATA scores. It uses a two-stage approach: IFs predict VPIs, and then IFs + VPIs predict VATA.
- An Elastic Net Regression Model (ENRM) is used for inference, revealing the interpretable relationships between specific IFs, VPIs, and the final VATA score.
- Validation: VATA predictions are validated against real-world OTC data collected through field surveys (thermal walks) using metrics like subjective comfort ratings and physiological data (e.g., heart rate).
Detailed research framework diagram
Methodology Summary
- Study Area: Singapore (chosen for its diverse urban forms and consistent tropical climate).
- SVI Survey: 500 representative SVIs (selected via k-means clustering of 92,233 images) were evaluated by 176 participants in an online survey. Participants made pairwise comparisons for VATA and 19 VPIs. TrueSkill algorithm converted comparisons into scores (0-5 scale).
- IF Extraction: 5 categories of IFs (52 sub-features total) were extracted from SVIs using models like DeepLabV3+, ResNet-50, and Faster R-CNN.
- Model Training: MTNNL trained on IFs and VPI scores (60% train, 20% validation, 20% test split).
- Inference Modelling: ENRM trained to understand feature weights and relationships.
- Validation: Compared predicted VATA scores for 43 locations with OTC data (comfort ratings, heart rate, solar intensity, noise, altitude) collected during thermal walks at NUS.
Key Results
- Prediction Model Performance: The MTNNL model achieved superior performance (Adjusted R² = 0.7316) compared to other machine learning models, demonstrating the effectiveness of the two-stage (IF -> VPI -> VATA) approach.
- Validation Against OTC Data:
- Smoothed VATA scores showed a strong correlation with surveyed comfort ratings along the thermal walk path (Adjusted R² up to 0.75 using a moderate smoothing factor).
- A multivariate model combining VATA with physiological/environmental data (Heart rate, Solar intensity, Noise, Altitude - HSNA) explained significantly more variance in comfort (Adjusted R² = 0.889) than using IFs + HSNA (Adjusted R² = 0.778) or HSNA alone (Adjusted R² = 0.596).
- VATA Mapping: We generated a high-resolution map of VATA across Singapore, aggregated into hexagonal units. This map visually identifies areas with high (e.g., parks like Windsor Nature Park, East Coast Park) and low (e.g., parts of Choa Chu Kang) thermal affordance, guiding potential interventions.
VATA prediction results mapped across Singapore
- Inference Model Insights: The ENRM model (Adjusted R² = 0.744) revealed key factors:
- Positive Contributors to VATA: Vegetation, terrain, sky proportion, shading area, human-scale design elements, perceived humidity/wind, perceived beauty/safety.
- Negative Contributors to VATA: Traffic elements, complex/construction scenes, high pixel detail/contrast, perceived temperature/sunlight intensity, perceived traffic flow/complexity/boredom.
Discussion & Significance
The VATA framework provides a scalable, cost-effective, and validated method for assessing urban thermal affordance.
- Urban Planning Tool: High-resolution VATA maps help planners identify areas needing improvement and prioritise interventions like adding greenery or shading.
- Design Guidance: Inference models reveal which specific streetscape features (IFs) and perceptual qualities (VPIs) most influence thermal affordance, informing evidence-based design decisions.
- Continuous Monitoring: The framework supports a continuous monitoring cycle, using updated SVI data to refine models and track the impact of interventions over time.
Diagram illustrating the continuous monitoring and design cycle
- Transferability: While developed for Singapore, the methodology can be adapted to other cities by conducting local surveys and validations.
Limitations and Future Directions
- Temporal Variance: Did not account for time-of-day, weather, or seasonal changes in SVI.
- Validation Scope: Validation was limited to one path; broader validation across diverse locations and microclimates is needed.
- Data Sources: Could be enhanced by integrating satellite imagery, LST data, or detailed microclimate simulations.
- Survey Limitations: Online surveys have inherent limitations; incorporating expert assessments could be beneficial.
- Cross-City Validation: Testing the framework in different climatic and urban contexts is crucial.
Conclusion
This research introduces the novel concept of thermal affordance and the VATA framework for its assessment. By integrating SVI, human perception surveys, machine learning, and field validation, VATA offers a powerful tool to evaluate and improve thermal comfort in urban streetscapes. It provides actionable insights for sustainable urban planning and design, contributing to the creation of more liveable and resilient cities.